TorchNeuron Profiling Guide Shows How AWS Trainium Performance Is Measured and Optimized
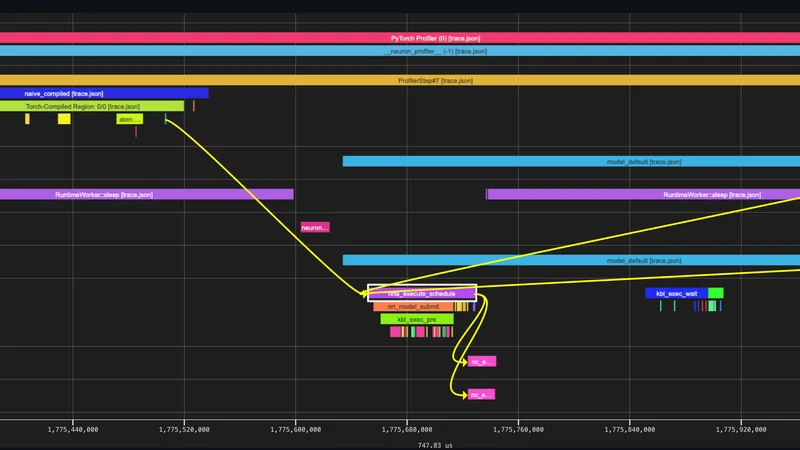
Image: Hugging Face Blog
Main Takeaway
TorchNeuron’s first profiling guide shows developers how to trace PyTorch inference across AWS Trainium and identify system-level performance bottlenecks.
Jump to Key PointsSummary
What TorchNeuron profiling covers
TorchNeuron’s first profiling guide teaches developers how to analyze PyTorch inference performance on AWS Trainium, focusing on where execution time is spent across the host system and accelerator. The walkthrough targets practitioners with limited profiling experience and uses AWS’s open-source native PyTorch backend as its working environment, according to the Hugging Face Blog.
TorchNeuron brings familiar PyTorch workflows to Trainium, including eager execution and torch.compile. Developers can move models and tensors to the neuron device with a change such as model.to('neuron'), but the public beta still requires attention to supported versions, static shapes, and workload compatibility. Those constraints make measurement essential: a small code change does not guarantee efficient execution.
Why system-level traces matter
System-level profiling shows how an inference request moves through application code, CPU activity, runtime scheduling, data transfers, and Trainium execution. That view helps separate time spent waiting on the host from time spent running model operations on the accelerator.
The AWS Neuron documentation describes Neuron Explorer as a tool for capturing system-level and device-level profiles, then viewing system traces in Perfetto. The profiling workflow identifies regions associated with LLM context encoding and other inference stages, giving developers a timeline rather than a single latency number. That distinction matters because an apparently slow model can be limited by orchestration, input preparation, synchronization, or device utilization.
From trace to bottleneck
A useful profile begins with a repeatable workload, controlled inputs, and enough warm-up iterations to separate startup costs from steady-state inference. Developers then inspect the system timeline for gaps, overlapping CPU and accelerator work, queue delays, and transfers that interrupt execution.
The same reasoning applies beyond the tutorial’s example. AWS documentation presents profiling for a vLLM-hosted inference workload, while the Hugging Face walkthrough frames the process around TorchNeuron and standard PyTorch execution. Together, they show a path from application-level latency to device-level detail. AWS’s broader Neuron development tooling also emphasizes profiling as part of an iterative optimization loop, alongside kernel and model changes.
What developers must control
TorchNeuron’s beta status makes environment and model structure central to profiling results. Static tensor shapes are a key requirement highlighted in developer coverage, and the software stack depends on pinned PyTorch and Neuron versions. A benchmark that changes shapes, compilation settings, or runtime versions between tests can produce misleading comparisons.
The device abstraction lowers the first barrier to adoption, but it doesn't erase hardware-specific behavior. Teams still need to confirm operator support, compile behavior, memory movement, and performance under realistic batch sizes and sequence lengths. Techaffiliate and Dev both stress that minimal migration effort is different from unchanged model support or guaranteed speedups, while AWS documentation provides the profiling mechanics needed to investigate those differences.
The hardware software contest
TorchNeuron is part of AWS’s effort to make Trainium easier to use for the large PyTorch developer base that traditionally targets Nvidia GPUs. AWS launched the backend as an open-source public beta in October 2026, positioning a familiar framework interface as a way to reduce migration friction. Gadgets Now described the release as a challenge to Nvidia’s software advantage, while TechCrunch placed it alongside Google’s open-source TorchTPU effort.
The competitive issue is developer time as much as chip specifications. Nvidia’s position rests heavily on a mature software ecosystem, established tools, and broad model support. TorchNeuron, profiling utilities, and related Neuron development tools address that ecosystem directly by helping teams port workloads, find inefficiencies, and iterate on performance. The result depends on the quality of compatibility, documentation, and measured production economics, not the one-line device change alone.
What happens next for Trainium users
The immediate next step is disciplined benchmarking. Teams evaluating TorchNeuron should profile representative inference traffic, compare end-to-end latency with accelerator time, and test compilation, shape stability, batching, and memory behavior before drawing cost or throughput conclusions.
That process will also expose where the beta needs to mature. Broader operator coverage, clearer performance guidance, stable version support, and stronger integrations with serving stacks will determine whether TorchNeuron becomes a routine PyTorch target. Neuron Explorer and Perfetto give developers a concrete diagnostic path today, while AWS’s agent-assisted optimization work points toward a larger push to make Trainium tuning accessible beyond specialists.
Key Points
TorchNeuron’s first profiling guide maps PyTorch inference bottlenecks across AWS Trainium system timelines.
Neuron Explorer and Perfetto expose CPU activity, transfers, scheduling gaps, and accelerator execution.
TorchNeuron simplifies PyTorch migration, but static shapes and pinned versions remain beta constraints.
AWS positions TorchNeuron against Nvidia’s software advantage through open tooling and profiling workflows.
Reliable Trainium benchmarks require warm-up runs, controlled inputs, and realistic serving workloads.
Questions Answered
TorchNeuron is AWS’s open-source native PyTorch backend for Trainium. It lets developers target the accelerator through the neuron device while retaining familiar PyTorch workflows, including eager execution and torch.compile.
TorchNeuron profiling captures system and device timelines with Neuron Explorer, then displays system activity in Perfetto. Developers can compare CPU work, transfers, scheduling, synchronization, and accelerator execution to locate the source of latency.
TorchNeuron public beta requires attention to static shapes, supported operators, and pinned PyTorch and Neuron versions. A small code change can simplify migration, but it doesn't guarantee unchanged model support or faster inference.
AWS Neuron Explorer profiles vLLM workloads on Trainium, while Perfetto displays the captured system-level timeline. The workflow helps inspect phases such as LLM context encoding and identify host or device delays.
AWS uses TorchNeuron to reduce the software and migration barriers that reinforce Nvidia GPU adoption. An accessible PyTorch backend, profiling tools, and optimization assistance make Trainium easier for existing PyTorch teams to evaluate and deploy.
Source Reliability
38% of sources are highly trusted · Avg reliability: 63
 Aws.amazon
Go deeper with Organic Intel
Simple AI systems for your life, work, and business. Each one includes copyable prompts, guides, and downloadable resources.
Explore Systems